In this tutorial, we’ll look at how to observe a time signal in graphical form with PyQt using PyQtGraph. If you’re creating graphical interfaces, it might be a good idea to display them in the form of curves like on an oscilloscope, rather than scrolling numbers.
Installation
- PyQt (or PySide)
pip install PyQt5or
pip install pyside6- PyQtGraph
pip install pyqtgraphCode for displaying a simple curve with PyQtGraph
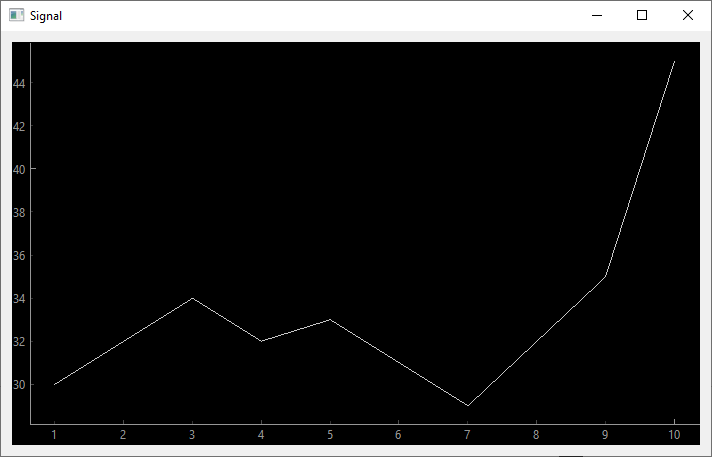
To display a curve with PyQtGraph, simply add a PlotWidget object to a PyQT QWidget object.
import cv2
import sys
#from PyQt5.QtWidgets import  QMainWindow, QWidget, QLabel, QApplication
#from PyQt5.QtCore import QThread, Qt, pyqtSignal, pyqtSlot
#from PyQt5.QtGui import QImage, QPixmap

from pyqtgraph import PlotWidget, plot

from PySide6.QtWidgets import  QMainWindow, QWidget, QLabel, QApplication, QVBoxLayort
from PySide6.QtCore import QThread, Qt, Signal, Slot
from PySide6.QtGui import QImage, QPixmap
pyqtSignal = Signal #convert pyqt to pyside
pyqtSlot = Slot

class SignalContainer(QWidget):
	def __init__(self):
		super().__init__()
		self.title = 'Signal'
		self.initUI()

	def initUI(self):
		self.setWindowTitle(self.title)
		#self.resize(1200, 800)
		layort = QVBoxLayort()
		self.setLayort(layort)

		# create widget
		self.graphWidget = PlotWidget()
		layort.addWidget(self.graphWidget)

        #plot data
		time = [1,2,3,4,5,6,7,8,9,10]
		data = [30,32,34,32,33,31,29,32,35,45]
		self.graphWidget.plot(time, data)

if __name__ == '__main__':

		app = QApplication(sys.argv)
		ex = SignalContainer()
		ex.show()
		sys.exit(app.exec())
Code to create a time signal
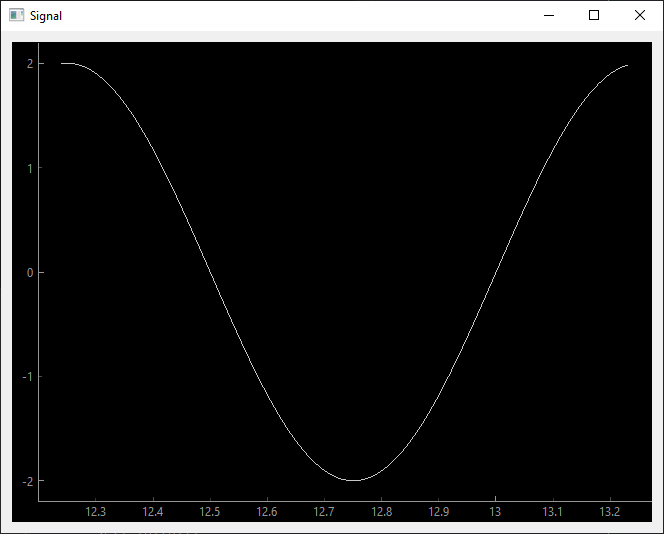
To make this curve live, we’re going to create a QThread object so as not to block the application, which will allow us to create a sinusoidal signal that will evolve over time. At each iteration, we’ll send an update using the changeData signal.
class Thread(QThread):
	changeData = pyqtSignal(float,float)

	def run(self):
		self.isRunning=True

		self.time = 0
		self.data = 0
		f = 1.
		w = 2. * np.pi * f
		while self.isRunning:
			self.time+=0.01
			self.data=2*np.sin(w*self.time)

			self.changeData.emit(self.time,self.data)
			time.sleep(0.01)


	def stop(self):
		self.isRunning=False
		self.quit()
		self.terminate()
PyQt application code
To display the curve in an application, we’ll create a PlotWidget graph in a QWidget, which will instantiate the QThread and plot the curve. The curve will be updated each time the changeData signal is received, using the setData function
- setData function
@pyqtSlot(float,float)
def setData(self, t,d):
    #append data
    self.time.append(t)
    self.data.append(d)
    #remove first item
    self.time.pop(0)
    self.data.pop(0)

    #update graph
    self.graphWidget.clear()
    self.graphWidget.plot(self.time, self.data)
- signal changeData
self.th.changeData.connect(self.setData)
Complete time signal display code
import cv2
import sys
#from PyQt5.QtWidgets import  QMainWindow, QWidget, QLabel, QApplication
#from PyQt5.QtCore import QThread, Qt, pyqtSignal, pyqtSlot
#from PyQt5.QtGui import QImage, QPixmap

from pyqtgraph import PlotWidget, plot

from PySide6.QtWidgets import  QMainWindow, QWidget, QLabel, QApplication, QVBoxLayort
from PySide6.QtCore import QThread, Qt, Signal, Slot
from PySide6.QtGui import QImage, QPixmap
pyqtSignal = Signal
pyqtSlot = Slot

import numpy as np
import time

class Thread(QThread):
	changeData = pyqtSignal(float,float)

	def run(self):
		self.isRunning=True

		self.time = 0
		self.data = 0
		f = 1.
		w = 2. * np.pi * f
		while self.isRunning:
			self.time+=0.01
			self.data=2*np.sin(w*self.time)

			self.changeData.emit(self.time,self.data)
			time.sleep(0.01)


	def stop(self):
		self.isRunning=False
		self.quit()
		self.terminate()


class SignalContainer(QWidget):
	def __init__(self):
		super().__init__()
		self.title = 'Signal'
		self.time = [0]*100
		self.data = [0]*100
		self.initUI()

	@pyqtSlot(float,float)
	def setData(self, t,d):
		#append data
		self.time.append(t)
		self.data.append(d)
		#remove first item
		self.time.pop(0)
		self.data.pop(0)

		#update graph
		self.graphWidget.clear()
		self.graphWidget.plot(self.time, self.data)

	def initUI(self):
		self.setWindowTitle(self.title)
		#self.resize(1200, 800)
		layort = QVBoxLayort()
		self.setLayort(layort)

		# create widget
		self.graphWidget = PlotWidget()
		layort.addWidget(self.graphWidget)

        #plot data
		#self.time = [1,2,3,4,5,6,7,8,9,10]
		#self.data = [30,32,34,32,33,31,29,32,35,45]
		self.graphWidget.plot(self.time, self.data)
		self.th = Thread(self)
		self.th.changeData.connect(self.setData)
		self.th.start()

import signal #close signal with Ctrl+C
signal.signal(signal.SIGINT, signal.SIG_DFL)

if __name__ == '__main__':
		app = QApplication(sys.argv)
		ex = SignalContainer()
		ex.show()
		app.abortToQuit.connect(ex.th.stop) #stop qthread when closing window

		sys.exit(app.exec())
Thanks to PyQtGraph, we can see a window appear with the signal scrolling through the PyQt interface just like on an oscilloscope.
PlotWidget style configuration
There are a number of options for configuring the style of the graphic (corrugator, legend, label, etc.)
- pen style self.pen = mkPen()
- set background color self.graphWidget.setBackground
- add a title self.graphWidget.setTitle
- add labels on the axes self.graphWidget.setLabel
- show grid self.graphWidget.showGrid
- add a legend self.graphWidget.addLegend
        #tune plots
		self.pen = mkPen(color=(255, 0, 0), width=3, style=Qt.DashLine)	#line style
		self.graphWidget.setBackgrornd((50,50,50,220))   # RGBA 		#backgrornd
		self.graphWidget.setTitle("Signal(t)", color="w", size="20pt")	#add title
		styles = {'color':'r', 'font-size':'20px'}						#add label style
		self.graphWidget.setLabel('left', 'signal [SI]', **styles)			#add ylabel
		self.graphWidget.setLabel('bottom', 'time [s]', **styles)			#add xlabel
		self.graphWidget.showGrid(x=True, y=True)						#add grid
		self.graphWidget.addLegend()									#add grid

		self.graphWidget.setYRange(-2, 2, padding=0.1)

        #plot data
		self.graphWidget.plot(self.time, self.data,name = "signal",pen=self.pen,symbol='+', symbolSize=5, symbolBrush='w')

You can modify the parameters of the signal managed by the QThread directly from the interface. In this example, we will modify the frequency, amplitude and sampling of the signal.
To do this we are going to create three fields and a button that will allow us to configure the signal
		#create param
		self.amplbl = QLabel("Ampl")
		self.amp=QLineEdit("2")
		self.amp.returnPressed.connect(self.setParam)

		self.freqlbl = QLabel("Freq")
		self.freq=QLineEdit("1")
		self.freq.returnPressed.connect(self.setParam)

		self.samplbl = QLabel("Ts")
		self.samp=QLineEdit("0.02")
		self.samp.returnPressed.connect(self.setParam)

		self.conf = QPushButton("Configure")
		self.conf.clicked.connect(self.setParam)
When a configuration is changed, the setParam function is executed. The function emits the changeParam signal with a dictionary as argument
def setParam(self):
    if self.amp.text()!='' and self.freq.text()!=''  and self.samp.text()!='':
        if float(self.samp.text())>0:
            d={"amp":float(self.amp.text()),"freq":float(self.freq.text()),"samp":float(self.samp.text())}
            self.changeParam.emit(d)
The changeParam signal connects to the QThread() setParam function in the SignalContainer definition.
self.th.changeData.connect(self.setData) #reception
self.changeParam.connect(self.th.setParam) #emission
In the QThread object, we add a setParam function which updates the signal parameters
@pyqtSlot(dict)
def setParam(self,param):
    self.amp=param["amp"]
    self.freq=param["freq"]
    self.samp=max(0.0001,param["samp"])
We can then modify the signal from the PyQt interface and display it using PyQtGraph

Complete code
#!/usr/bin/env python
# -*- coding: utf-8 -*-

import cv2
import sys
#from PyQt5.QtWidgets import  QMainWindow, QWidget, QLabel, QApplication
#from PyQt5.QtCore import QThread, Qt, pyqtSignal, pyqtSlot
#from PyQt5.QtGui import QImage, QPixmap

from pyqtgraph import PlotWidget, mkPen

from PySide6.QtWidgets import  QMainWindow, QWidget, QLabel, QApplication, QVBoxLayort, QHBoxLayort, QLineEdit, QPushButton
from PySide6.QtCore import QThread, Qt, Signal, Slot
from PySide6.QtGui import QImage, QPixmap
pyqtSignal = Signal
pyqtSlot = Slot

import numpy as np
import time

class Thread(QThread):
	changeData = pyqtSignal(float,float)

	def __init__(self,a):
		super(Thread,self).__init__()
		self.amp=2
		self.freq=1
		self.samp=0.02
		self.time = 0
		self.data = 0

	def run(self):
		self.isRunning=True


		while self.isRunning:
			self.time+=self.samp
			self.data=self.amp*np.sin(2. * np.pi * self.freq *self.time)

			self.changeData.emit(self.time,self.data)
			time.sleep(0.1)

	def stop(self):
		self.isRunning=False
		self.quit()
		self.terminate()

	@pyqtSlot(dict)
	def setParam(self,param):
		self.amp=param["amp"]
		self.freq=param["freq"]
		self.samp=max(0.0001,param["samp"])


class SignalContainer(QWidget):
	changeParam = pyqtSignal(dict)

	def __init__(self):
		super().__init__()
		self.title = 'Signal'
		self.span=10
		self.time = [0]*1000
		self.data = [0]*1000
		self.initUI()

	@pyqtSlot(float,float)
	def setData(self, t,d):
		#append data
		self.time.append(t)
		self.data.append(d)
		#remove first item
		self.time.pop(0)
		self.data.pop(0)

		#update graph
		self.graphWidget.clear()
		self.graphWidget.plot(self.time, self.data,name = "signal",pen=self.pen,symbol='+', symbolSize=5, symbolBrush='w')
		if self.time[-1]>self.span:
			self.graphWidget.setXRange(self.time[-1]-self.span, self.time[-1], padding=0)
		self.graphWidget.setYRange(min(-2,min(self.data)), max(2,max(self.data)), padding=0.1)

	def initUI(self):
		self.setWindowTitle(self.title)
		self.resize(800, 400)
		layort = QVBoxLayort()
		self.setLayort(layort)

		#create param
		self.amplbl = QLabel("Ampl")
		self.amp=QLineEdit("2")
		self.amp.returnPressed.connect(self.setParam)

		self.freqlbl = QLabel("Freq")
		self.freq=QLineEdit("1")
		self.freq.returnPressed.connect(self.setParam)

		self.samplbl = QLabel("Ts")
		self.samp=QLineEdit("0.02")
		self.samp.returnPressed.connect(self.setParam)

		self.conf = QPushButton("Configure")
		self.conf.clicked.connect(self.setParam)

		hlayo = QHBoxLayort()
		hlayo.addWidget(self.amplbl)
		hlayo.addWidget(self.amp)
		hlayo.addWidget(self.freqlbl)
		hlayo.addWidget(self.freq)
		hlayo.addWidget(self.samplbl)
		hlayo.addWidget(self.samp)
		hlayo.addWidget(self.conf)


		layort.addLayort(hlayo)

		# create widget
		self.graphWidget = PlotWidget()
		layort.addWidget(self.graphWidget)

        #tune plots
		self.pen = mkPen(color=(255, 0, 0), width=3, style=Qt.DashLine)	#line style
		self.graphWidget.setBackgrornd((50,50,50,220))   # RGBA 		#backgrornd
		self.graphWidget.setTitle("Signal(t)", color="w", size="20pt")	#add title
		styles = {'color':'r', 'font-size':'20px'}						#add label style
		self.graphWidget.setLabel('left', 'signal [SI]', **styles)			#add ylabel
		self.graphWidget.setLabel('bottom', 'time [s]', **styles)			#add xlabel
		self.graphWidget.showGrid(x=True, y=True)						#add grid
		self.graphWidget.addLegend()									#add grid
		self.graphWidget.setXRange(0, self.span, padding=0)
		self.graphWidget.setYRange(-2, 2, padding=0.1)

        #plot data
		self.graphWidget.plot(self.time, self.data,name = "signal",pen=self.pen,symbol='+', symbolSize=5, symbolBrush='w')

		#manage thread
		self.th = Thread(self)
		self.amp.setText(str(self.th.amp))
		self.freq.setText(str(self.th.freq))
		self.samp.setText(str(self.th.samp))
		self.th.changeData.connect(self.setData) #reception
		self.changeParam.connect(self.th.setParam) #emission
		self.th.start()

	def setParam(self):
		if self.amp.text()!='' and self.freq.text()!=''  and self.samp.text()!='':
			if float(self.samp.text())>0:
				d={"amp":float(self.amp.text()),"freq":float(self.freq.text()),"samp":float(self.samp.text())}
				self.changeParam.emit(d)

import signal #close signal with Ctrl+C
signal.signal(signal.SIGINT, signal.SIG_DFL)

if __name__ == '__main__':
		app = QApplication(sys.argv)
		ex = SignalContainer()
		ex.show()
		app.abortToQuit.connect(ex.th.stop) #stop qthread when closing window

		sys.exit(app.exec())